BadBuddha Customs
Indicators › Momentum › ZenZones
BadBuddha's Zen Zones
Identify high-momentum candles and visualize dynamic support/resistance zones around these hot bars.
NinjaTrader 8
Intermediate
LITE
FREE
PRO
$ 79
ABOUT THIS INDICATOR
What it does
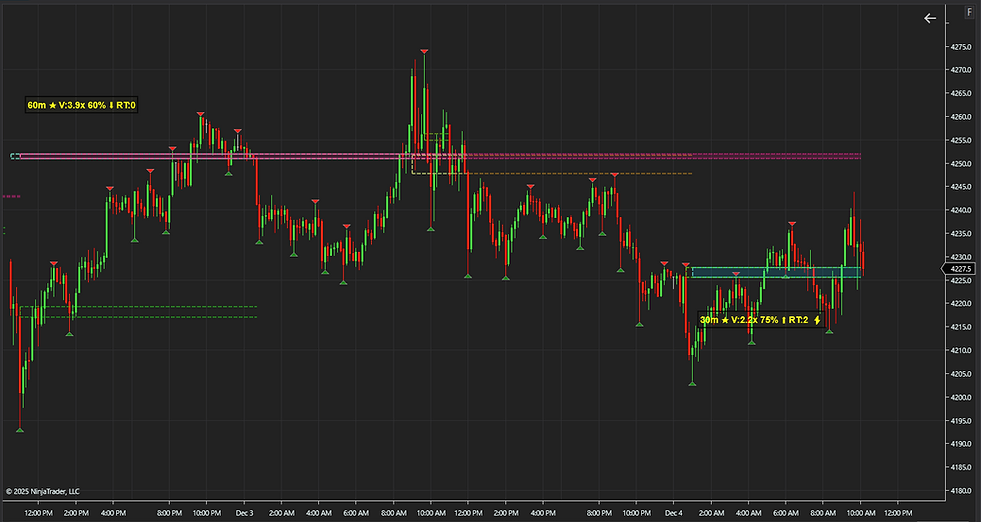
ZenZones is an advanced multi-timeframe supply and demand zone detection indicator that identifies high-probability trading levels based on momentum analysis. The indicator detects "hot bars" - candles that exhibit both above-average body size and above-average volume - which signal areas of significant institutional buying or selling activity. Unlike traditional support and resistance tools that simply mark swing highs and lows, ZenZones uses statistical analysis to identify zones where meaningful order flow actually occurred.
The PRO version supports simultaneous analysis of up to three timeframes (ranging from 1-minute to daily charts), allowing traders to see intraday zones alongside higher-timeframe structure on a single chart. Each detected zone receives a strength rating from 1-5 stars based on configurable criteria including volume ratio, body size, and multi-timeframe confluence. The indicator automatically detects when zones from different timeframes overlap, highlighting these "confluence zones" as particularly significant levels where institutional activity appeared across multiple time horizons.
ZenZones PRO includes comprehensive zone lifecycle management with intelligent invalidation logic. Users can choose between body-only or full-candle break detection, and configure how many consecutive closes through a zone are required before removal. When a zone is broken, the indicator can optionally flip it to a "re-test zone" - converting former support into resistance or vice versa - for tracking the next potential bounce or continuation.
Advanced analytics track each zone's success rate (how often price respects vs. breaks the zone), touch count, volume profile (where volume concentrated within the zone), and age. Session-based filtering allows display of only today's zones, this week's, or this month's. The indicator also integrates market structure analysis, identifying swing highs and lows and boosting zone strength when zones align with key structural levels. Optional Fibonacci extension levels can be drawn within each zone for precise entry and target planning.
WHAT'S INCLUDED
Features
✓
Feature Name
Feature description goes here
PRO
HAVE QUESTIONS??
Frequently Asked Questions
Question goes here...
Answer goes here...
YOU MIGHT ALSO LIKE
Related Indicators

Technical Analysis
Indicator Name
FREE
$79
Indicator Name
Indicator Name
FREE
$79